
Projects

Projects
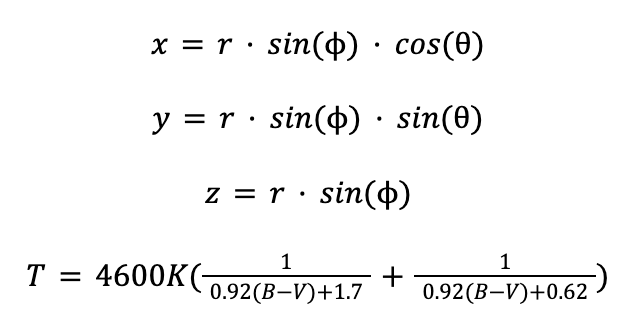
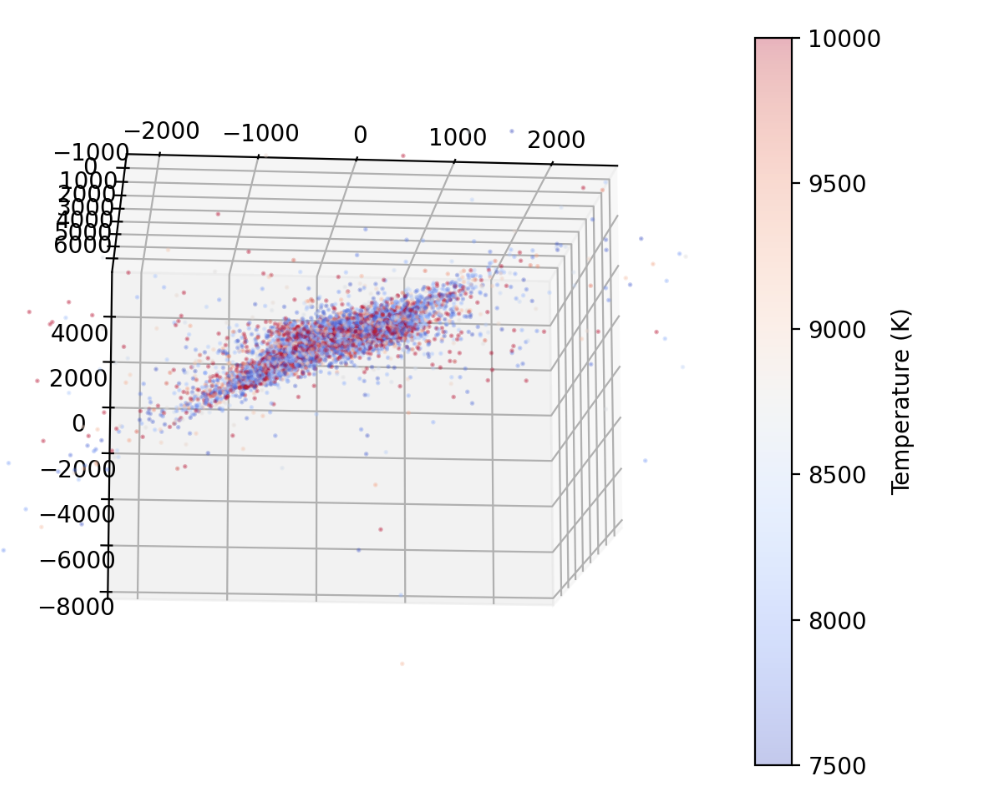
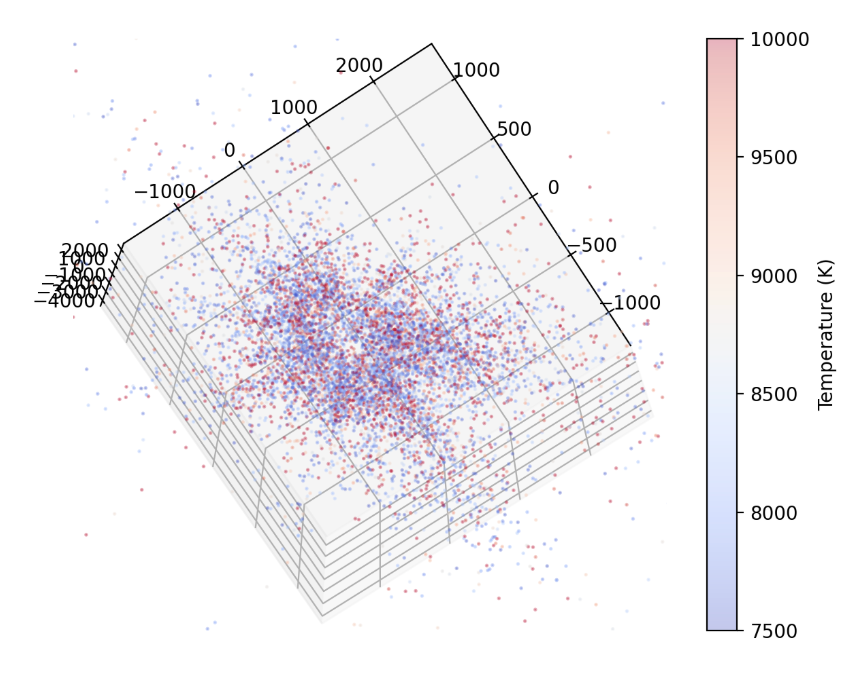
My final project for when I took the Python for Astronomers was to attempt to observe the shape of the Milky Way galaxy and temperature distributions using a dataset of millions of stars in the Galaxy. Specifically, the dataset I used was the AT-HYG dataset, which includes data from the Tycho-2 Catalog Hipparcos Catalog, Yale Bright Star Catalog, and the Gliese Catalog of Nearby Stars. In order to plot the stars in 3D space, I converted the right ascension, declination, and distance values into cartesian coordinates. I then used the stars' B-V magnitude to calculate their temperatures using Ballesteros' formula. The disk shape can be clearly seen in this plot!
This is an article I wrote for EPS C162 (Planetry Astrophysics), about how Venus became a runaway greenhouse. All the hand-drawn illustrations were made by me.
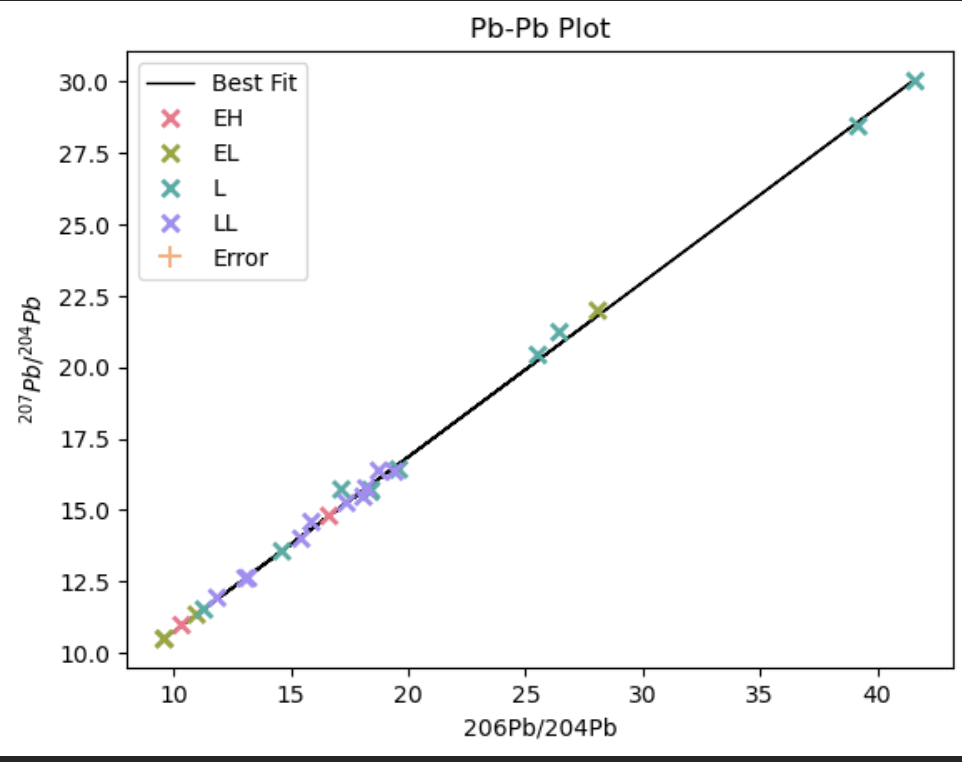
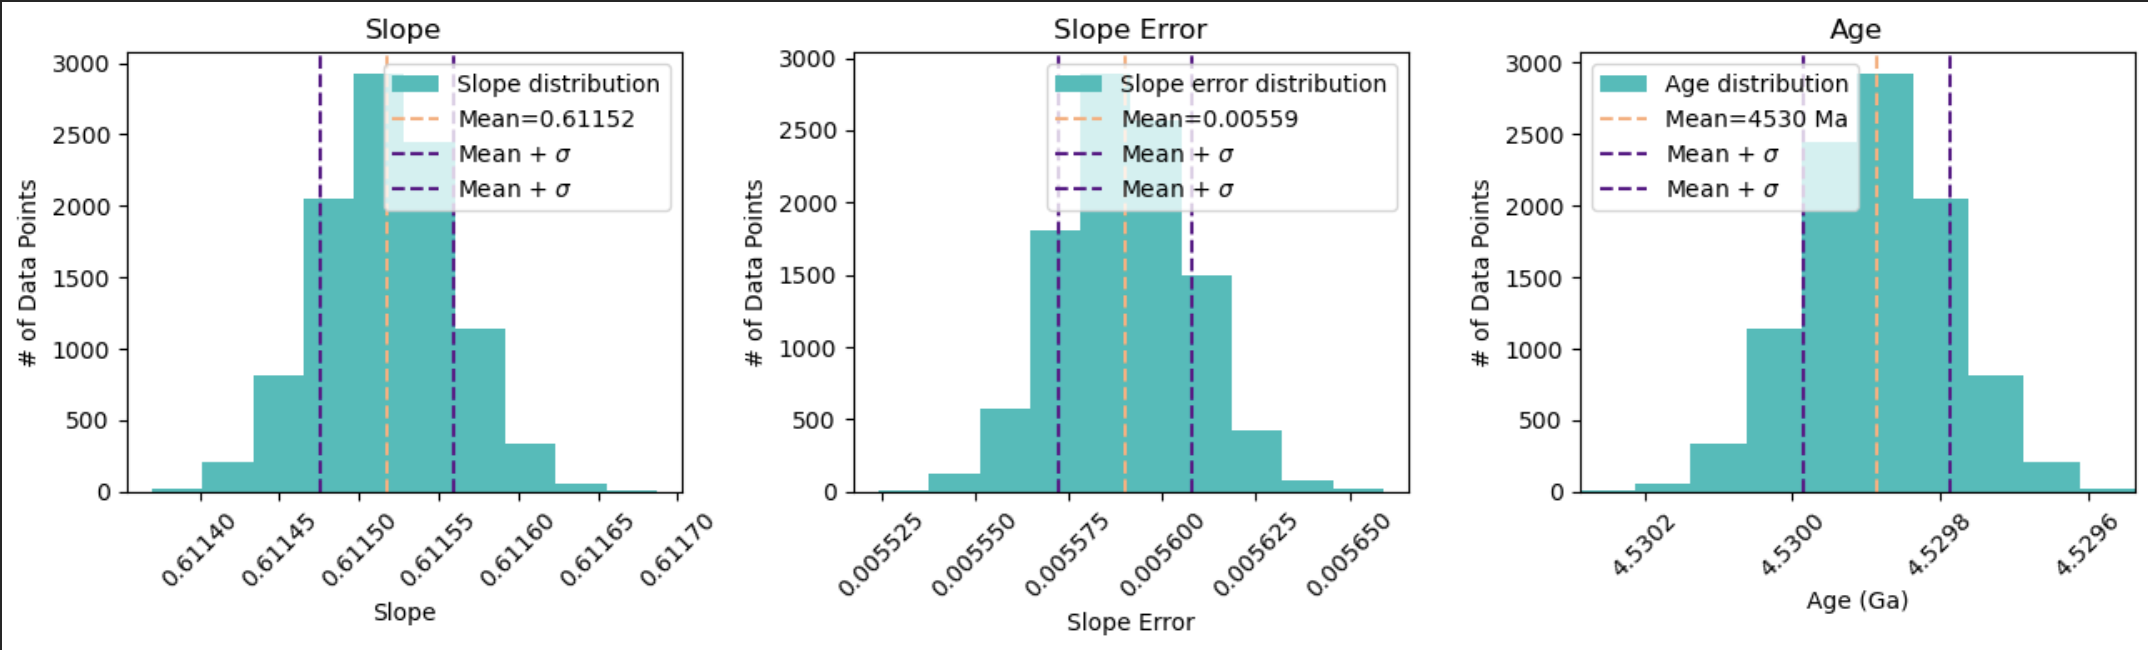
For my final project for EPS 88 (Python for Earth Sciences), I conducted data analysis on chondrite isotope data I sourced from Palk et al. 2018. I plotted the lead isotope ratios to find the slope, which I then used to solve for the age of the chondrites. I also used the Monte Carlo method to propogate the error from the best-fit slope measurement and data onto the age.